Wednesday, June 24, 2009

BIRT report - database resource localization

I just thought of explaining how to display the localized resources from database. Basically, we create a mapping between the data in a column and the resource key in the resource bundle.

1. Add resource bundle to your report.
In the Layout tab, click anywhere on the blank space. Go to Resources tab. Select your resource bundle file.

2. Select the table where you contains the columns from your dataset. Go to the "Map" tab. Create a new mapping by clicking on the "Add" button.

3. Click on the "..." button to choose the property key from the resource bundle. The screenshot is given below.
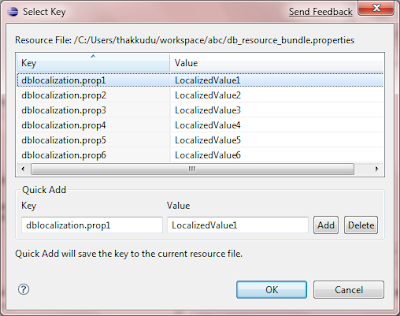
When the column "city" in the dataset contains the value "Nantes", retrieve the value from the resource bundle whoose property key is dblocalization.prop1. This will instruct the report engine to display "LocalizedValue1" when it encounters "Nantes" in the dataset.

This should be done for all the values that you expect to be localized and shown in the report.

4. All set. Preview the report.


It would have been nicer if there is a only one mapping needed to values in the column and the resource bundle file name. Lets wait BIRT's upcoming features..

Tuesday, June 23, 2009

How to pass a ResultSet to BIRT report


I tried to pass a JDBC ResultSet (java.sql.ResultSet) and could not find a straight forward way like passing the ResultSet as an argument to the report during generationd. However this is what I finally arrived at. This solution could be used to pass a collection of objects from a java class to the BIRT report.


Steps:-

  1. In the java application where we are planning to generate the report using BIRT engine, execute the sql query and fetch the resultset. Add the resultset as a parameter to the report.

      ResultSet rs = getResultSet() // a function that executes the query and returns resultset

      HashMap params = new HashMap();

      params.put(myResultSet”, rs);

  2. In the report, create a scripted data source. Create a scripted data set with the column names that you wish to use in the report. For e.g lets create a data set with one column “EMP_NAME”.

  3. This step is to glue the columns in the resultset that came as parameter and the columns in the scripted data set. This can be achieved in two ways.

      a) Using javascript function

        1. In the scripted data set, implement the open(), fetch() methods. I'll explain in this another post.

      b) Using a java event handler that extends ScriptedDataSetEventAdapter class (org.eclipse.birt.report.engine.api.script.eventadapter.ScriptedDataSetEventAdapter) and implement the fetch(), open() and beforeOpen() methods. Lets handle one by one.

    1. Create a class called TestHandler (test.TestHandler)
    2. Declare a member variable for the ResultSet

        ResultSet resultSet;

    3. Retrieve the parameter myResultSet set from the java class in Step 1 and store it in the member variable.

      beforeOpen(IDataSetInstance dataSet, IReportContext reportContext) {

        super.beforeOpen(dataSet, reportContext);

        //retrieve the parameter myResultSet set from the java class in Step 1

        resultSet = (ResultSet)reportContext.getParameterValue(“myResultSet”);

        }

    4. Position to resultset to the first row in the open()

      public void open(IDataSetInstance dataSet) {

        super.open(dataSet);

        if(resultSet != null)

          resultSet.next();

      }

    5. Map the column of the resultset and the column of the scripted data set.

      public boolean fetch(IDataSetInstance datSet, IUPdatableDataSetRow row) {

        if(resultSet.isAfterLast())

          return false;// to indicate that there are no more rows left to process

        row.setColumnValue(“EMP_NAME”, resultSet.getString(1));

        resultSet.next();

        return true; // to indicate that more rows to follow

      }

  4. Do the cleanup activities. Close the resultset, statement and release the connection.

  5. Go to the report designer. Go to Outline window. Select the scripted data set created in Step 2. Go to the Property Editor and select "Event Handler" tab. In the Event Handler Class, add the fully qualified class name created in step 3 (test.TestHandler).
  6. All set. Run the java program to initiate the engine and invoke the report and see the results.


My experiments with truth.. oops.. no.. BIRT and Jasper

BIRT vs Jasper

Over the past couple of weeks I was trying to explore the features supported in BIRT and Jasper. To a beginner, both the tools seem to be difficult. I mean, to get a working sample on them, it takes some time. I went through numerous blogs, tutorials and my firefox bookmarks started becoming unmanageable. So I thought of publishing my experiences so that it will help someone.

The basic principle behind both reporting tools is the same.

1. Design a report using a report designer (Save it in a xml file)

2. Use the report engine to parse the xml file and fill the data in the report

3. Render the report in a format of your choice (pdf, html, csv, etc..)

Performance metrics

BIRT seems to be 10-25% slower than Jasper for as long as the caching mechanism is used. Once the caching (virtualizer) is used, BIRT gives better performance (around 50% more) when compared to Jasper.

BIRT Gotchas

· Always sorts the records once a group is created. BIRT 2.3 talks about a field for turning off the sort, there is no difference on the turn-around time.

· Using BIRT in a web application requires you to add 30MB of libraries to your deployable (ear or war).

· The pdf rendering mechanism generated huge (really hhhhhuuuuggggeeee) pdf documents.

· Integration with java does not seem to be straightforward. For instance, passing a collection of objects to a BIRT report requires you to browse through numerous blogs and tutorials on birt-exchange and then apply your brain.

· Report rendering in xml format does not yield a good quality xml.

Jasper Gotchas

· iReport. The report designer does not seem to be intuitive.

· Localization of database resources does not seem to be possible

· Csv export gives extra blank columns (extra commas) in the output file

· Excel output does not include the graphic images (logos etc..)

· Does not provide a good facility for component based model, object libraries.

· Lacks concept of theme in the report elements except charts.

· Does not have a default style per element (one style for table, another one for textfield etc..). It has a default style for the report.

· Once virtualizer is used to overcome outofmemory error, the performance degrades drastically